
Adult obesity · every U.S. county · updated October 2026
The weight of place: 2023 adult obesity by U.S. county
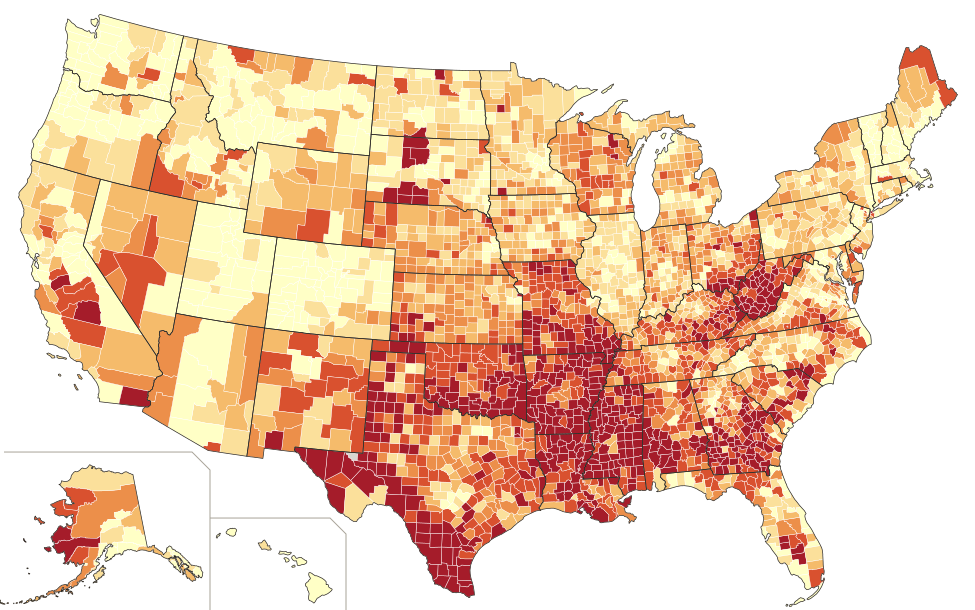
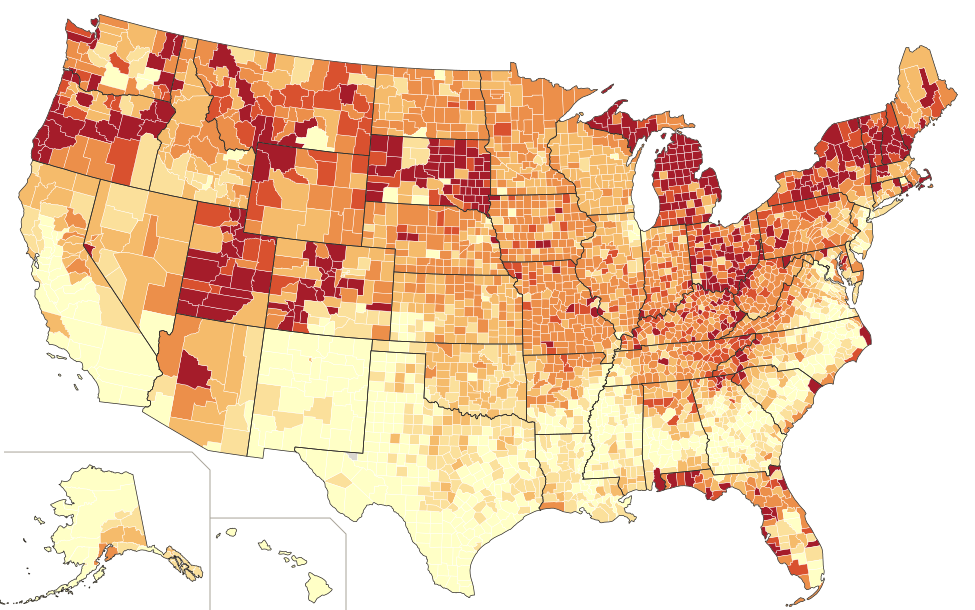
Six colors, each holding about one-sixth of counties. The Deep South, Appalachia, South Texas and tribal lands are darkest; Colorado and the coastal metros are lightest. National rate: 32.9%.
Fixed five-point bands. 1,003 counties are at 40% or higher, but together they hold only 12% of the population. The 196 counties under 30% hold a quarter of it.
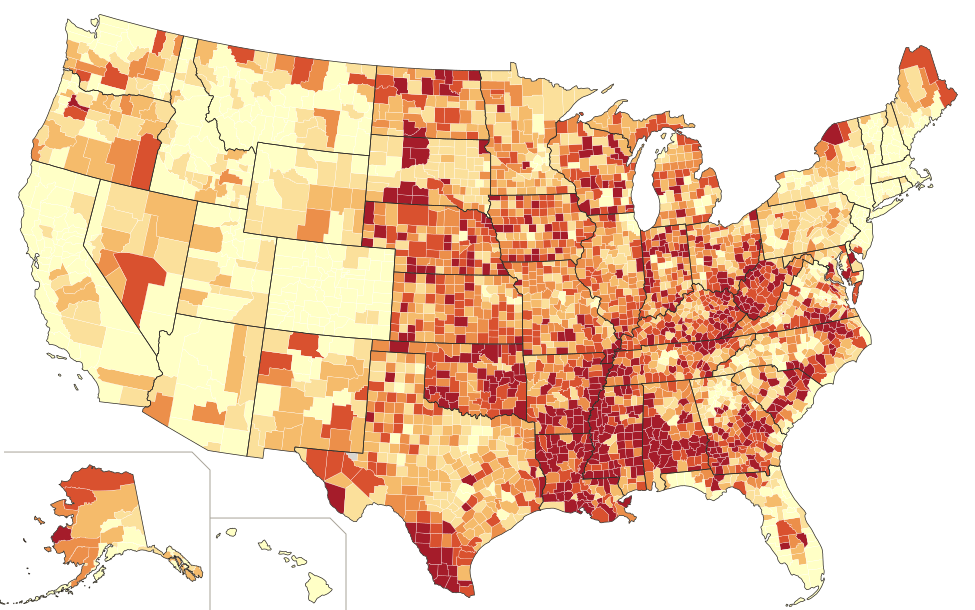
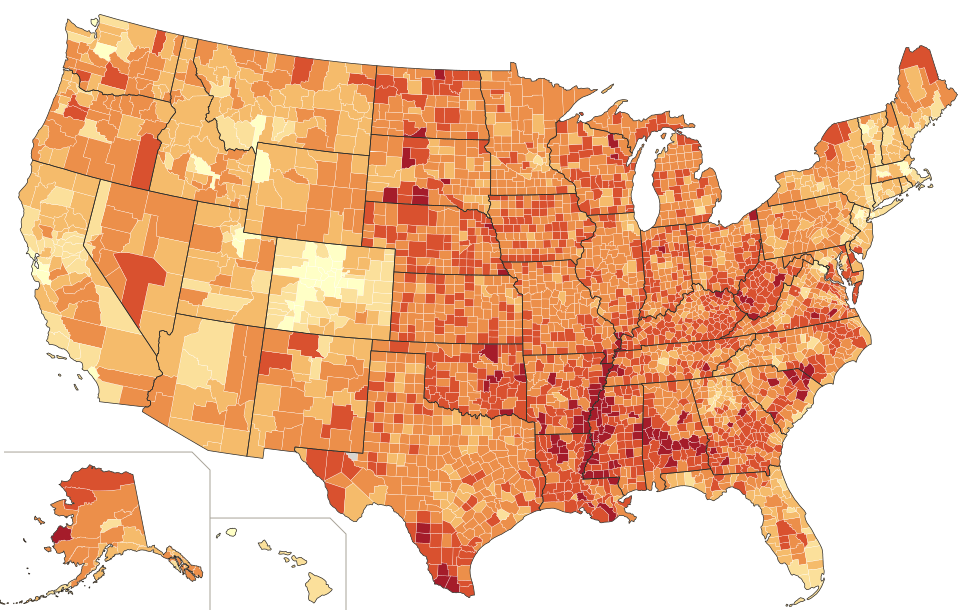
2023 age-adjusted adult obesity rate (equal-count bins)
- 17.1% to 33.5% 526 counties · 48.9% of people
- 33.6% to 36.3% 537 · 17.6%
- 36.4% to 38.2% 518 · 13.4%
- 38.3% to 39.8% 523 · 7.7%
- 39.9% to 41.6% 524 · 6.6%
- 41.7% to 54.0% 515 · 5.7%
2023 age-adjusted adult obesity rate (five-point bands)
- Under 25% 44 counties · 6.6% of people
- 25.0% to 29.9% 152 · 18.4%
- 30.0% to 34.9% 538 · 32.5%
- 35.0% to 39.9% 1,406 · 30.7%
- 40.0% to 44.9% 882 · 10.7%
- 45% or more 121 · 1.2%
No estimate (Loving County, TX: population 43)
Data: CDC PLACES, 2025 release: model-based, age-adjusted estimates of adults with BMI 30 or higher, from the 2023 Behavioral Risk Factor Surveillance System. Kentucky and Pennsylvania lacked usable 2023 survey data, so their counties use the 2024 release (2022 data). National rate: 32.9%. Median county: 38.2%. Range: 17.1% (San Francisco, CA) to 54.0% (Perry, AL).
Reading the map: big rural counties fill most of the area, but most people live in small metro counties with lower rates. Half of Americans live in the lightest sixth of counties; about 6% live in the darkest sixth.
Boundaries: U.S. Census Bureau 2023 cartographic files (including Connecticut's planning regions). Map style after Max Masnick (2011). Download the county data (CSV, 3,143 rows).
Adult obesity in America · county data, 2023
One in three American adults has obesity, but the rate depends heavily on where they live, from 17% in San Francisco to 54% in rural Alabama. Poverty, schooling and the way a region eats, works and gets around draw a dark band across the South. The same band shows up in diabetes, heart disease and stroke, and in how long people live: 7.6 years less, on average, in the poorest fifth of counties than in the least poor.
32.9%
of U.S. adults had obesity in 2023 (age-adjusted, CDC PLACES). The median county is higher, at 38.2%.
12%
of Americans live in the 1,003 counties at 40% or higher. Half live in the lightest sixth of counties.
17%–54%
from San Francisco County, California, to Perry County, Alabama: a 37-point gap between counties.
r = 0.75
the correlation between obesity and physical inactivity, the strongest single factor we tested.
01 · Land versus people
A dark map, a lighter country
Large, thinly populated rural counties fill most of the map, and they tend to have higher rates. Small metro counties, where most people live, tend to be lower. With fixed five-point bands, 1,003 counties are at 40% or higher but hold only 12% of the population. The 196 counties under 30% hold 25% of it.
On the equal-count map, the lightest sixth of counties is home to 49% of Americans and the darkest sixth to about 6%. That is why the national rate (32.9%) sits well below the median county (38.2%). The map shows where high obesity is concentrated, not where most people with obesity live.
02 · Poverty
Where money is short, weight goes up
Sort counties by child poverty and obesity climbs at every step, from 34.4% in the least-poor fifth to 41.5% in the poorest. Median household income fits even more tightly (r = −0.64): counties under about $53,000 average 41.5%, while those above about $76,000 average 33.3%.
The links are well documented. Refined grains, added sugar and oils are the cheapest calories per dollar. Food insecurity, meaning households unsure of the next meal, drives cycles of scarcity and overeating; among counties where CDC reports it, food insecurity tracks obesity at r = 0.57. Shift work and long commutes leave less time to cook or exercise. Chronic financial stress affects appetite and fat storage. Poorer counties also have fewer full-service grocery stores, parks, sidewalks and gyms.
Obesity by county child-poverty rate, in fifths
Average county obesity rate, 2023. Bars start at zero.
Obesity by county median household income, in fifths
Income from ACS 2019–2023.
03 · Education
A degree shows up on the map
Education draws nearly the same picture. In counties where the fewest adults aged 25 to 44 have any college, the obesity rate averages 40.7%. Where the most do, it is 34.0%. CDC’s newest state survey (2025) shows the same thing for individuals: 38.1% of adults without a high-school diploma have obesity, compared with 27.8% of college graduates.
The shape matters. High-school graduates (35.1%) and people with some college (36.8%) are close together; the big drop comes with a four-year degree. Part of that runs through income, but not all of it. A degree tends to bring jobs with health insurance, desk-and-gym schedules and more control over time, along with health and nutrition literacy, social circles where running clubs and fitness are normal, and a longer planning horizon. It also shapes where people live: graduates cluster in metros like Boulder, Seattle and the Bay Area, which are the lightest places on the map.
Obesity by share of adults 25–44 with some college, in fifths
Average county obesity rate, 2023.
Obesity by individual education, U.S. adults
CDC Adult Obesity Prevalence Maps, 2025 BRFSS.
04 · Culture and place
How a region eats, works and moves
Together, child poverty, college attainment and rurality explain about 36% of the county-to-county variation in obesity. Adding physical inactivity, the share of adults who get no leisure-time exercise, raises that to 57%. On its own, inactivity is the strongest predictor we tested (r = 0.75).
Inactivity is only partly an individual choice. It reflects climate, the built environment, the kind of work people do and what is normal where they live. That is where culture comes in, and the map shows it in six regional stories.
The Black Belt and the Delta
up to 54.0%The highest-rate counties in the country (Perry, Greene and Wilcox in Alabama; Humphreys and Holmes in Mississippi; East Carroll in Louisiana) sit in the Black Belt and Mississippi Delta. The plantation economy, sharecropping and Jim Crow left some of the deepest persistent poverty in the U.S., few supermarkets and thin health care. The “Southern dietary pattern” of fried foods, processed meats, added fats and sweet drinks was the largest single factor behind the Black–white gap in new high blood pressure in the REGARDS study (JAMA, 2018). That diet grew out of history and economics, not taste alone.
Appalachia
WV 40.8%West Virginia, where McDowell County is at 46.1%, has the highest average of any state, and eastern Kentucky forms the same core. Contributing factors include decades of coal decline, low incomes, older populations, steep terrain with few sidewalks, and long drives to anything, including grocery stores and doctors. Home cooking built around cheap, filling, preserved foods is a strong regional tradition.
Native nations
up to 50.2%Many dark spots in the Dakotas, Montana, Alaska and the Southwest trace tribal lands: Rolette County, ND (Turtle Mountain) at 50.2%, Oglala Lakota County, SD at 47.7%, and Kusilvak, AK at 47.0%. CDC finds American Indian and Alaska Native adults at or above 35% in 36 of 44 reporting states. Researchers point to the forced loss of traditional food systems, generations of reliance on government commodity foods, and some of the highest poverty rates in the country.
The Texas border
Starr 45.8%The Rio Grande Valley (Starr, Hidalgo, Cameron) and Webb County form another dark cluster. High poverty and lower college attainment combine with summer heat that discourages outdoor activity for much of the year and car-dependent development. CDC finds Hispanic adults at or above 35% in 32 of 44 reporting states. Hispanic population share by itself is only weakly related to county obesity, which suggests that poverty and environment do more of the work than culture.
Rural life and the car
38.7% vs 34.9%The most rural fifth of counties averages 38.7%, compared with 34.9% in the most urban. Daily movement has been engineered out of rural life: farm work is mechanized, trips are long car rides, sidewalks and gyms are scarce, and a dollar store is often the nearest food source. Counties where fewer than about 43% of residents live near a park or gym average 39.6%; where 83% or more do, 34.2%.
The light spots
CO 26.2%Colorado has the lowest average of any state except Hawaii and the District of Columbia, and Boulder and Pitkin are among the five leanest counties. Outdoor recreation is part of local identity there, populations skew young and college-educated, and active people move in, a selection effect that flatters the numbers. Some studies also find lower obesity at high altitude, though the cause is debated. San Francisco, Manhattan, Marin and Santa Clara follow the coastal-metro pattern: high incomes, degrees, walkable streets and transit.
Lowest counties, 2023
- San Francisco, CA17.1%
- Boulder, CO17.4%
- Summit, UT19.3%
- New York (Manhattan), NY19.5%
- Pitkin, CO20.3%
- La Plata, CO20.8%
- Marin, CA21.3%
- Denver, CO21.6%
Highest counties, 2023
- Perry, AL54.0%
- Greene, AL53.4%
- Humphreys, MS53.0%
- Wilcox, AL51.9%
- East Carroll, LA51.7%
- Jefferson, MS51.7%
- Holmes, MS51.5%
- Lowndes, AL51.3%
05 · Beyond weight
Diabetes, heart disease, stroke and cancer follow the same map
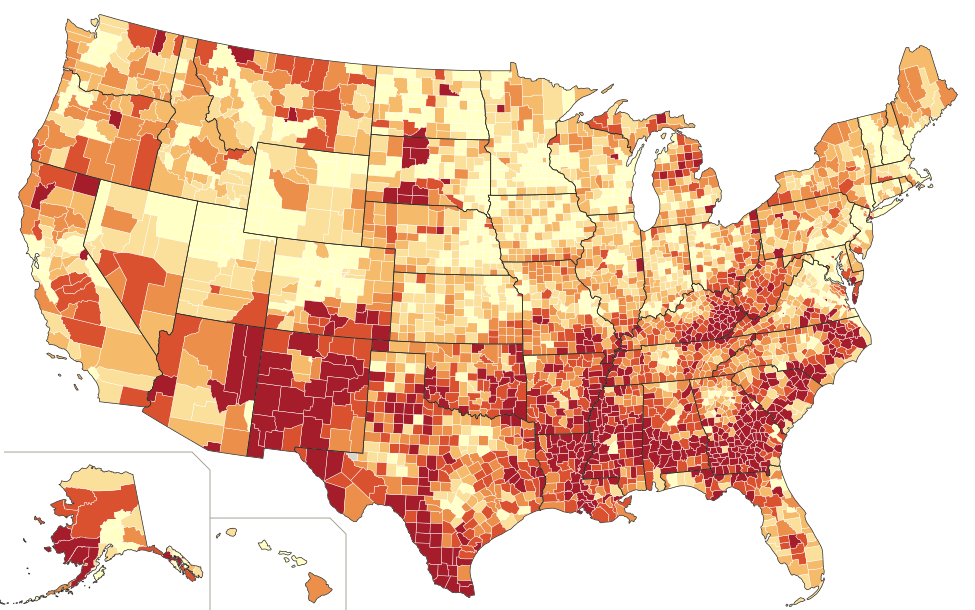
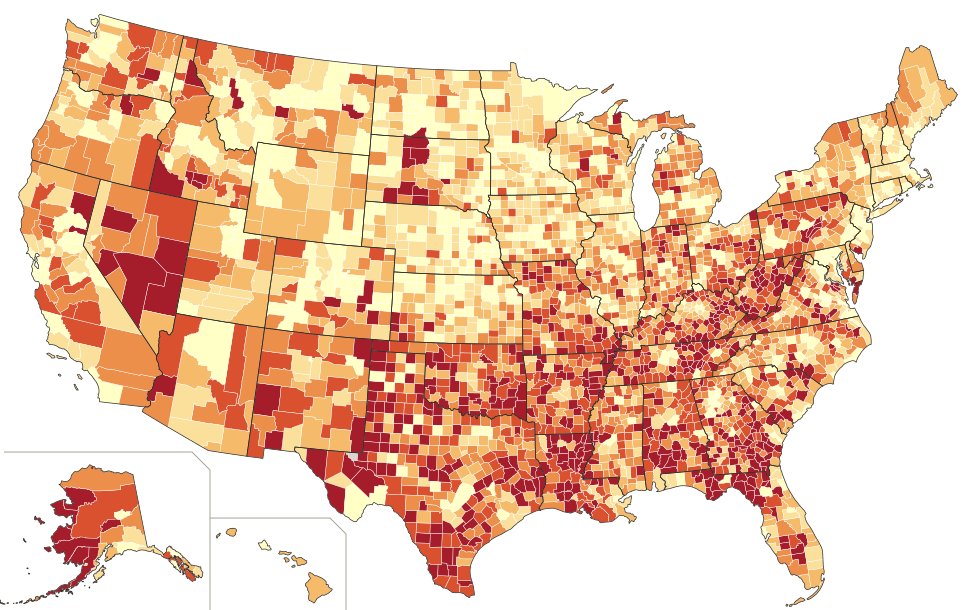
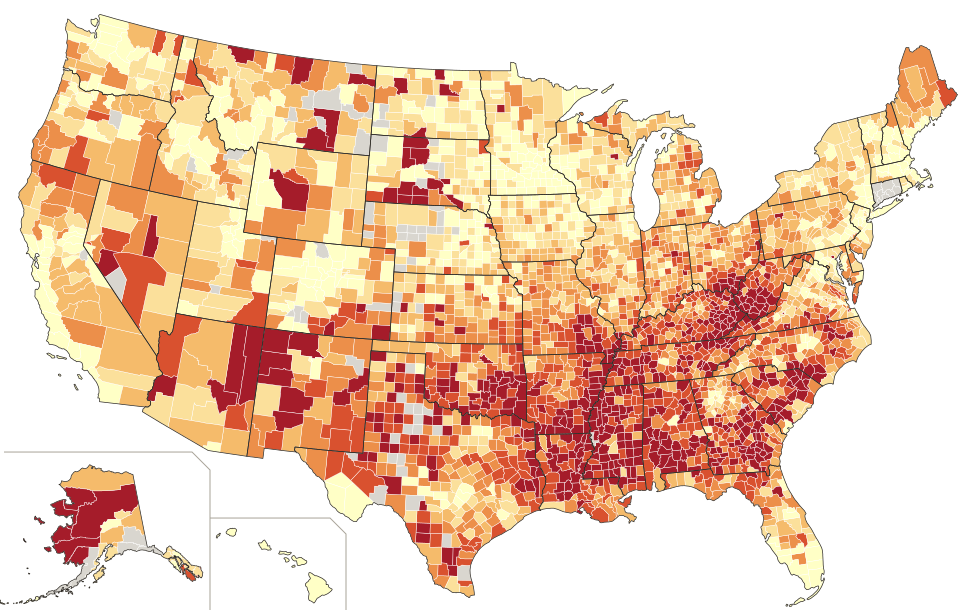
The band that darkens the obesity map runs through three of these four disease maps. Diabetes, coronary heart disease and stroke are all darkest in the Delta, the Black Belt, Appalachia, Oklahoma and on tribal lands, and lightest in the Colorado Rockies, the coastal metros and the suburban Northeast. Each one tracks child poverty more closely than it tracks obesity itself: stroke at r = 0.87, diabetes at 0.82 and heart disease at 0.78, against 0.67 to 0.69 for obesity.
Cancer is the exception, and the reason is in what it measures. CDC’s county figure counts adults who have ever been told they had cancer. That number rises where people are screened, diagnosed and survive, which is why it is highest in South Dakota, New Hampshire and northern Michigan and lowest in South Texas, the reverse of the other maps. It is a measure of living with cancer, not of dying from it.
Diabetes U.S. 10.3%
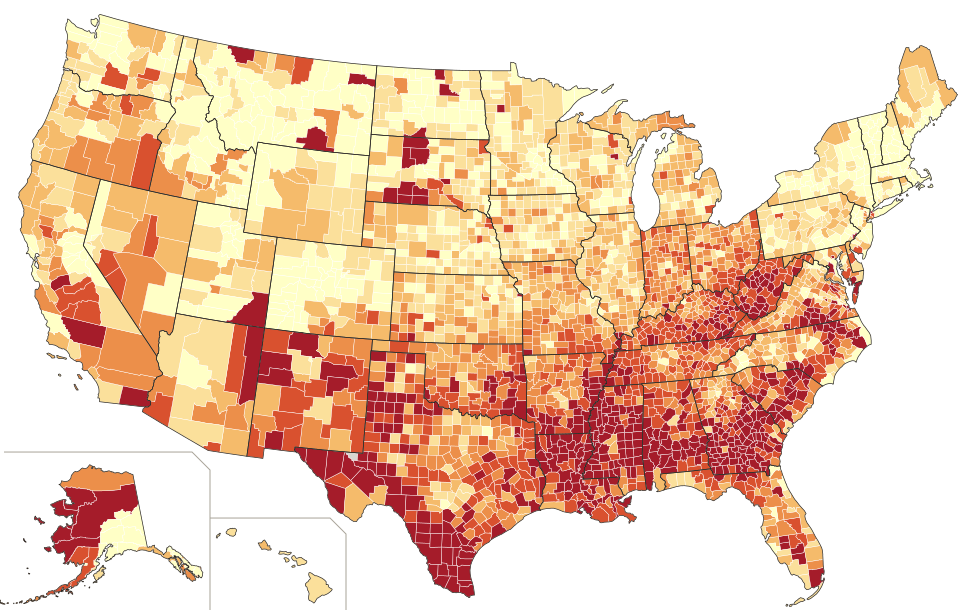
Coronary heart disease U.S. 5.3%
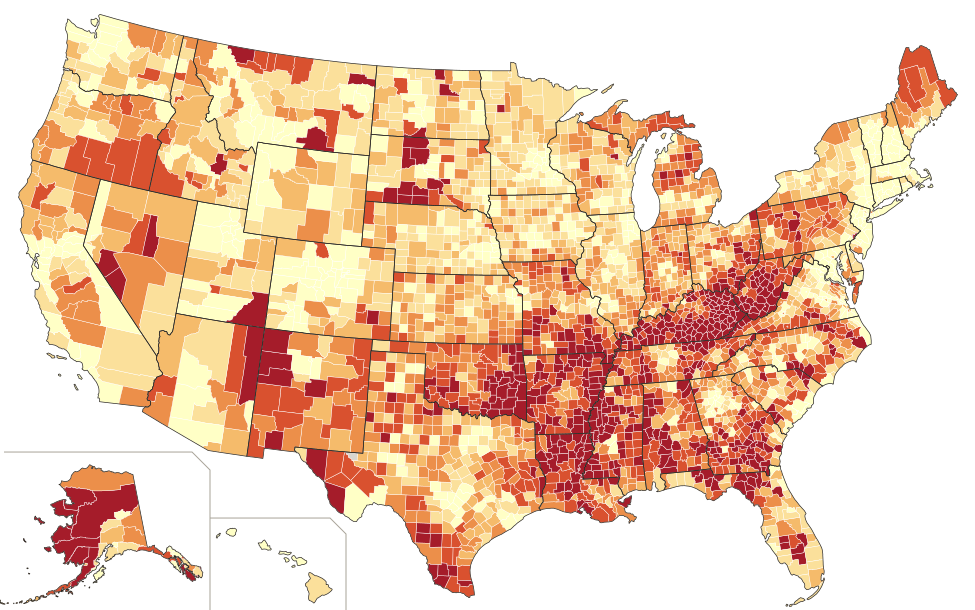
Stroke U.S. 2.9%
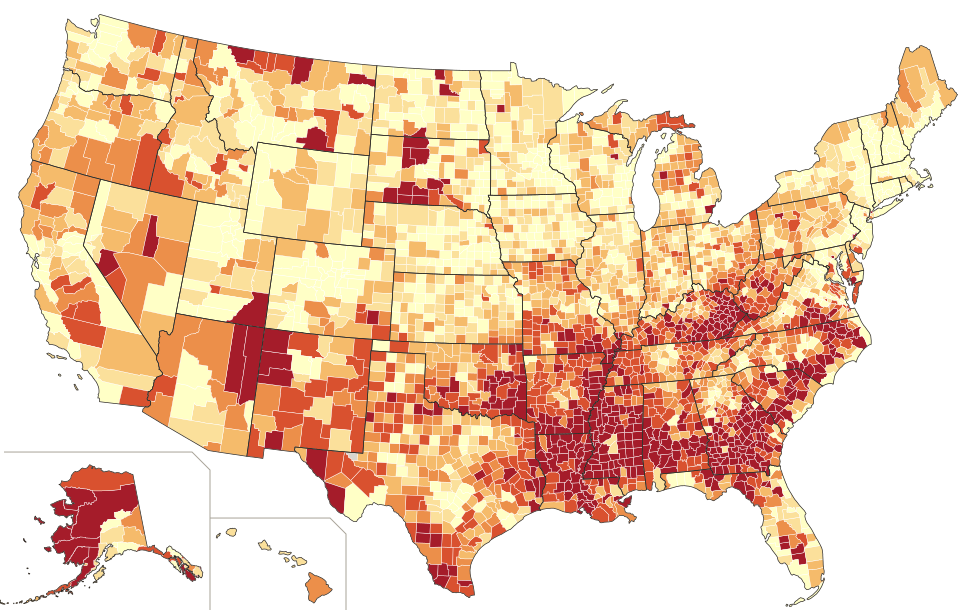
Cancer U.S. 6.6%
| Child poverty | Obesity | Diabetes | Heart disease | Stroke | Cancer | Life expectancy |
|---|---|---|---|---|---|---|
| 3–12% (lowest) | 34.4% | 9.1% | 5.1% | 2.7% | 7.2% | 78.9 yrs |
| 12–16% | 36.5% | 10.1% | 5.6% | 3.0% | 7.2% | 76.7 yrs |
| 16–20% | 37.3% | 10.7% | 6.0% | 3.2% | 7.1% | 75.3 yrs |
| 20–25% | 38.7% | 11.9% | 6.4% | 3.5% | 7.0% | 73.6 yrs |
| 25–63% (highest) | 41.5% | 14.2% | 7.0% | 4.1% | 6.5% | 71.2 yrs |
| Some college | Obesity | Diabetes | Heart disease | Stroke | Cancer | Life expectancy |
|---|---|---|---|---|---|---|
| 69–93% (most) | 34.0% | 9.3% | 5.2% | 2.7% | 7.2% | 78.7 yrs |
| 62–69% | 36.5% | 10.2% | 5.6% | 3.0% | 7.1% | 76.4 yrs |
| 56–62% | 38.0% | 11.0% | 6.0% | 3.2% | 7.1% | 74.8 yrs |
| 49–56% | 39.2% | 12.0% | 6.4% | 3.5% | 6.9% | 73.5 yrs |
| 17–49% (fewest) | 40.7% | 13.4% | 7.0% | 3.9% | 6.7% | 72.5 yrs |
Average of county rates in each fifth (equal-count county groups). Disease rates are age-adjusted shares of adults, 2023 (CDC PLACES). Life expectancy at birth, 2020–2022 deaths (County Health Rankings).
06 · Where it adds up
Life expectancy: a 7.6-year gap between the poorest and richest counties
Life expectancy collects everything above into one number. In the fifth of counties with the least child poverty, a baby born in 2020–2022 could expect to live 78.9 years. In the poorest fifth, 71.2. Counted by people rather than counties, the fifth of Americans in the least-poor counties live to 80.2 on average and the fifth in the poorest counties to 74.0.
Education draws the same line from the other side: 78.7 years where the most adults have some college, 72.5 where the fewest do. Of everything we tested, child poverty predicts a county’s life expectancy best (r = −0.73), ahead of income (0.70), inactivity (−0.71), obesity (−0.62) and college (0.60). The lowest figures among counties of 50,000 or more are on the Navajo Nation and in Robeson County, NC (Lumbee), Appalachian Alabama, West Virginia, Ohio and Kentucky, all under 70.
Longest lives, 2020–2022
- Fairfax, VA84.5 yrs 7.3% child poverty
- Marin, CA84.3 yrs 8.1% child poverty
- San Mateo, CA84.1 yrs 7.1% child poverty
- Collier, FL84.0 yrs 15.7% child poverty
- Arlington, VA83.9 yrs 8% child poverty
- Loudoun, VA83.8 yrs 4% child poverty
- Santa Clara, CA83.8 yrs 7.4% child poverty
Shortest lives, 2020–2022
- Apache, AZ63.8 yrs 35.7% child poverty
- McKinley, NM63.9 yrs 41.8% child poverty
- Navajo, AZ67.1 yrs 29% child poverty
- Walker, AL67.8 yrs 23.3% child poverty
- Robeson, NC67.9 yrs 37.9% child poverty
- Mercer, WV68.7 yrs 25.6% child poverty
- Scioto, OH69.2 yrs 24.1% child poverty
Counties of 50,000 or more. Ski-resort counties such as Eagle and Pitkin in Colorado post even higher figures, partly because older residents tend to move away before they die.
07 · Colorado and California
Why the healthy states are healthy, and where they aren’t
Colorado and California are the usual examples of healthy America, and on most of these measures they are. Colorado has the lowest adult obesity of any mainland state (26.2%), the third-lowest diabetes (8.0%, behind Vermont and New Hampshire) and, with Washington, the lowest physical inactivity (17.5%). California’s people live 79.4 years on average, two years longer than the country and seven longer than Mississippi.
Their advantages are the same ones this page keeps returning to. Colorado has 10.9% of children in poverty and 74% of young adults with some college; Mississippi has 24.2% and 62%, and West Virginia 19.6% and 56%. Add a culture built around hiking, skiing and cycling, younger populations and the steady arrival of fit, educated newcomers, and the state averages look very different from the Deep South’s.
| State | Obesity | Diabetes | Heart disease | Stroke | Life expectancy | Child poverty | Some college |
|---|---|---|---|---|---|---|---|
| Colorado | 26.2% | 8.0% | 4.7% | 2.6% | 78.6 yrs | 10.9% | 74% |
| California | 28.0% | 10.7% | 5.0% | 2.9% | 79.4 yrs | 14.6% | 68% |
| Hawaii | 26.1% | 10.2% | 4.8% | 3.0% | 81.4 yrs | 11.8% | 69% |
| Massachusetts | 27.9% | 8.6% | 4.9% | 2.6% | 79.7 yrs | 12.8% | 74% |
| Minnesota | 33.6% | 8.7% | 4.9% | 2.6% | 79.3 yrs | 10.3% | 75% |
| United States | 32.9% | 10.3% | 5.3% | 2.9% | 77.2 yrs | 15.9% | 67% |
| Kentucky | 38.5% | 11.9% | 6.9% | 3.4% | 73.5 yrs | 20.3% | 63% |
| Oklahoma | 39.3% | 11.6% | 6.4% | 3.3% | 73.9 yrs | 20.4% | 60% |
| Alabama | 39.6% | 12.8% | 6.0% | 3.5% | 73.5 yrs | 21.2% | 61% |
| Louisiana | 40.1% | 13.4% | 6.4% | 3.8% | 73.4 yrs | 25.4% | 59% |
| Mississippi | 40.7% | 13.6% | 6.3% | 3.9% | 72.1 yrs | 24.2% | 62% |
| West Virginia | 40.8% | 12.9% | 6.7% | 3.3% | 72.3 yrs | 19.6% | 56% |
Disease rates 2023, age-adjusted (CDC PLACES). Life expectancy 2020–2022. Child poverty 2023; some college among adults 25–44, 2019–2023 (County Health Rankings). U.S. disease rates are CDC’s national estimates.
Inside the healthy states, the same divide
A state average hides its counties. In California, San Mateo and Santa Clara, with about 7% of children in poverty and 80% of young adults with some college, live to about 84. A few hours’ drive away in the Central Valley, Kern County, with 25% child poverty and 52% some college, lives to 74.2, close to Alabama’s 73.5. Diabetes there runs at 13.3%, about Mississippi’s average.
Colorado has the same split. Douglas County, the suburbs south of Denver, has 3% child poverty and lives to 82.4. Pueblo, a steel town further down I-25, has 17% child poverty and lives to 72.5, nearly ten years less and level with West Virginia. Colorado’s lean culture keeps Pueblo’s obesity (32.3%) under the national median; it doesn’t close the gap in years.
California also shows that weight isn’t the whole story. Its obesity rate is among the lowest in the country, yet its diabetes rate (10.7%) is slightly above the national figure. Hispanic Californians, about four in ten residents, have higher diabetes rates than non-Hispanic white adults nationally (CDC), and the state’s highest diabetes counties, Imperial (14.6%), Merced, Kern and Tulare, are in the heavily Hispanic Imperial and Central valleys.
California
- San Mateo7.1% child poverty · 80% some college84.1 yrs
- Santa Clara7.4% child poverty · 82% some college83.8 yrs
- Placer6.1% child poverty · 80% some college81.2 yrs
- El Dorado7.8% child poverty · 73% some college80.6 yrs
- Madera24.2% child poverty · 51% some college76.5 yrs
- Fresno23.3% child poverty · 58% some college75.9 yrs
- Tulare23.2% child poverty · 52% some college75.5 yrs
- Kern24.8% child poverty · 52% some college74.2 yrs
Colorado
- Routt5.9% child poverty · 77% some college83.3 yrs
- Douglas3.1% child poverty · 88% some college82.4 yrs
- Broomfield5.1% child poverty · 86% some college81.9 yrs
- Elbert7.0% child poverty · 72% some college80.7 yrs
- Delta17.9% child poverty · 51% some college76.0 yrs
- Fremont20.3% child poverty · 42% some college75.6 yrs
- Montezuma21.5% child poverty · 57% some college74.3 yrs
- Pueblo17.3% child poverty · 60% some college72.5 yrs
Counties of 20,000 or more: the four with the least and the most child poverty in each state.
08 · What’s changing
The map may be at its darkest
CDC’s newest state figures (2025 survey) put 21 states between 35% and 40%, and none at 40% or higher. Gallup’s self-reported adult rate peaked at 39.9% in 2022 and fell to 37.0% in 2025, while the share of adults taking GLP-1 drugs such as Ozempic, Wegovy and Zepbound for weight loss rose from 5.8% to 12.4%.
Whether that decline reaches the darkest counties depends on the factors in this story: price, insurance coverage and access to prescribers. If the new drugs spread fastest where incomes and education are highest, the national number could fall while the gap between light and dark counties widens.
Gallup adult obesity rate (self-reported)
Bars start at zero. Survey method differs from CDC’s county estimates.
09 · Reading this responsibly
What these numbers can and can’t say
- County figures are modeled. CDC combines state survey responses with each county’s age, sex, race and poverty profile, so small rural counties partly reflect their demographics rather than direct measurement.
- Patterns across counties don’t show what causes obesity for any one person. Poverty, education and inactivity overlap heavily, and each stands in for things that are harder to measure.
- Body mass index is a rough screen. It ignores muscle and fat distribution, and these surveys use self-reported height and weight, which tends to understate obesity.
- Race and ethnicity patterns reflect history, income, neighborhood and access to care. They don’t point to biology or personal character.
- The disease figures are the share of adults who have ever been told they have the condition. They count people living with a disease, so they rise with diagnosis and survival as well as with illness. That is why cancer runs opposite to the other maps.
- Life expectancy uses 2020–2022 deaths, the worst years of COVID-19, which pulled every county’s figure down and hit poorer counties harder. Small counties with too few deaths for a stable estimate are left gray.